The Wazuh app runs on top of Kibana providing a visualization layer not only for alert management but also for monitoring the configuration and status of manager and agents. Easy way to browse through your alerts and to get a quick view on the system status. In this article, we are showing the Wazuh app using a simple use case, getting information about a brute-force attack.
I have built a quick and simple lab environment from scratch. It consist of just one server (a vm), where I have installed the Wazuh manager and use the agent that comes out-of-the-box with it to monitor this server. This is the fastest way to have a first POC and play around with the interface. However, since it is a new set up, it won’t have much data. Here is a link to the Wazuh documentation that will guide you through the installation process.
General view
Below you will find the main view of the Wazuh app, the first thing you will see when clicking Wazuh on the menu of your left hand side. The app has different sections to navigate around, as seen in the top menu. There is a second menu right below the top one that is related to the highlighted section at the top.
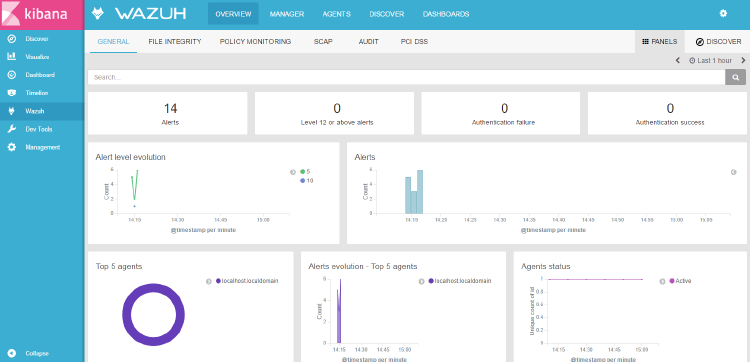
Let’s start with the general overview. As you can see, we still have very few data, however we can get an idea of the different info that the app provides. The first section shows a brief summary of the alerts, giving info regarding the total number of alerts, those that can be considered critical alerts and you might want to check out first, and lastly, those related with authentication success and failure. Additionally, there are a couple of graphs showing the alert evolution per time unit.
The second section is related to our different agents in our environment. Remember, in our case, we just have one agent. There is a third section, not shown in the screenshot below, that give us an alert summary, being able to check the most generated alerts and organize them by count or by level. It’s worth to mention that everything in the app is clickable, meaning that we can easily filter the data and everything will rearrange, including dashboards, just to show the filtered info.
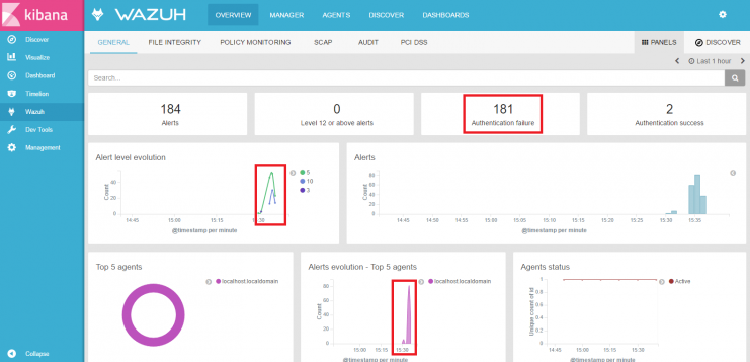
Now, I am going to generate a brute-force attack by failing to login several times. This is going to trigger an alert each time the authentication failed. It is interesting to see the different peaks shown in the graphs below. This is how the previous view will look after the attack.
Agents view
We can now navigate to the agent section by clicking “AGENTS” in the top menu. Here, we will see the different agents we have in our environment and some interesting information, such as, agent name, id, IP address and agent status (connected, diconnected or never connected).
If we go to our particular agent, we will find further details on what is going on whithin this agent. In other words, we applied a filter to show only the data related to this agent. Below is the agent view of the attacked server.
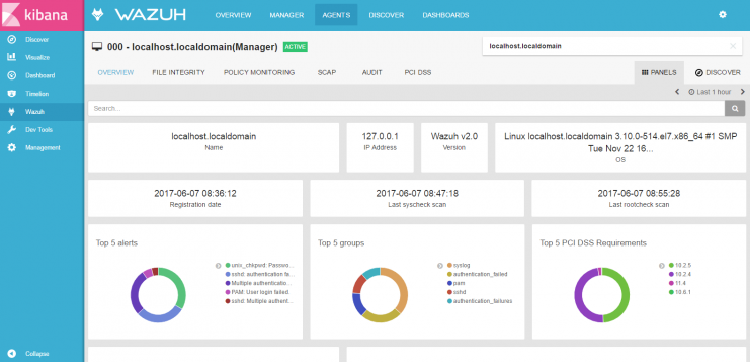
This view offers several useful graphs about the particular agent. One of them is the ‘Top 5 alerts’ graph, which includes ‘Multiple authentication failures’. The one on the right is telling us the PCI DSS requirements that are being affected by the generated alerts.
Now that we know that someone has been trying to login, the next step is to check the alert in detail. Next paragraph explains how to do it.
Discover tab
As you can see below, on the right side you can navigate from the “panels” tab to the “discover” tab. The panel tab is the right one when you want to see what is going on at a glance. However, if you want to get further details on a particular alert, you need to go to the discover tab. This is how it looks like:
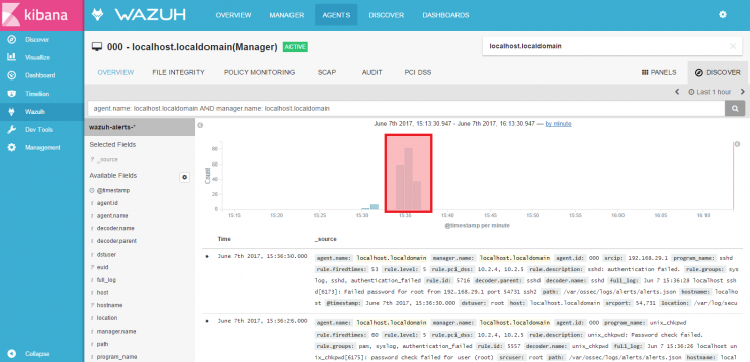
Note that it is possible to zoom in the graph framed in red, so we can get more specific data. Just select the graph area that you want. After that, it will show all the alerts that were triggered between the selected time. This is exactly what we have done and this is how it looks now:
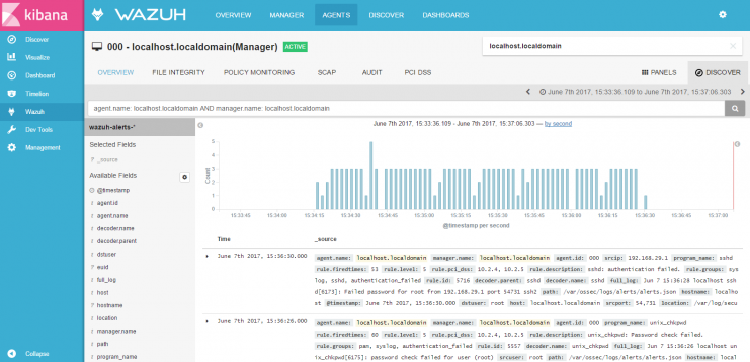
We can now open our authentication failure event and we will get the following info.
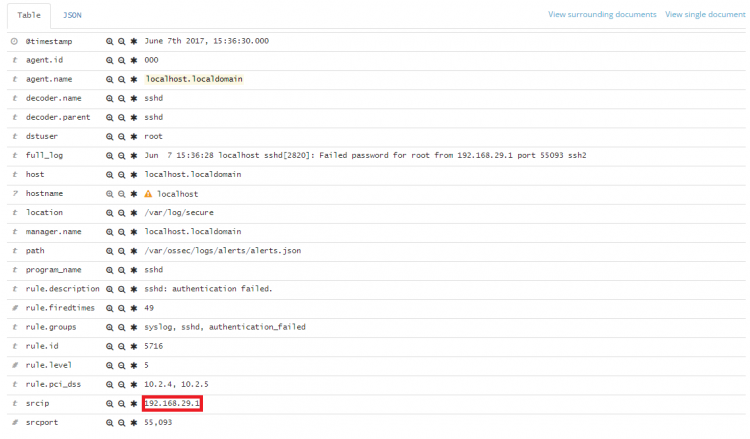
We find details such as the agent name and id, the number of times this alert has been fired, the level, the PCI control affected, etc. You can also see the source IP (in red), since a virtual machine has been used, this is an internal IP.
This is an example just to show you a little bit about the Wazuh app. I have used the smallest environment I could use. If you want to see the Wazuh app in larger environments I suggest taking a look to our youtube channel. Here you will find very interesting use cases, all using the Wazuh app.
If you have any questions about this, join our Slack #community channel! Our team and other contributors will help you.