Wazuh v3.7.0 released!
Hi everyone!
The team is pleased to announce the release of Wazuh v3.7.0! This new version comes with lots of additions and improvements, so we’re going to talk a little bit about them on this post.
Wazuh v3.7.0 includes two new modules to monitor Docker and Azure instances. These new integrations provide more monitoring capabilities.
Thanks to the Docker module, you can collect the activity from your containers such as starting, stopping or pausing events. Here’s a sample alert from a Docker container visualized on the Kibana’s Discover tab:
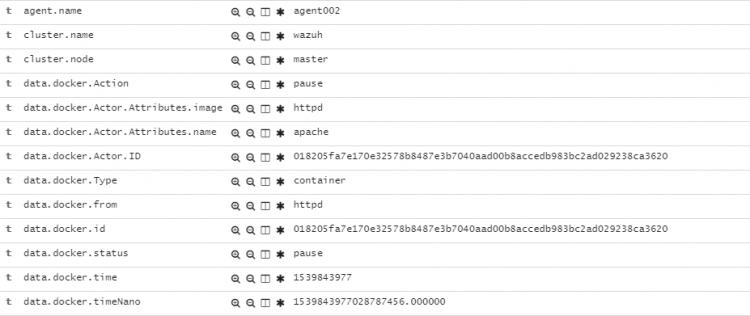
Find instructions to configure Wazuh for Docker on our documentation.
With the new Azure module, you can collect data from your services and instances activity. There are several ways to accomplish this:
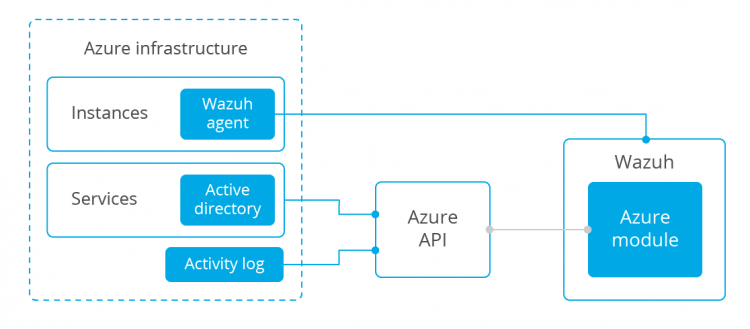
The new Azure module helps on the last two methods. Following some easy steps, you can configure and connect your manager to the Azure infrastructure and start getting logs and services data.
Here’s a sample alert obtained from Azure Log Analytics API displayed on the Kibana’s Discover tab:
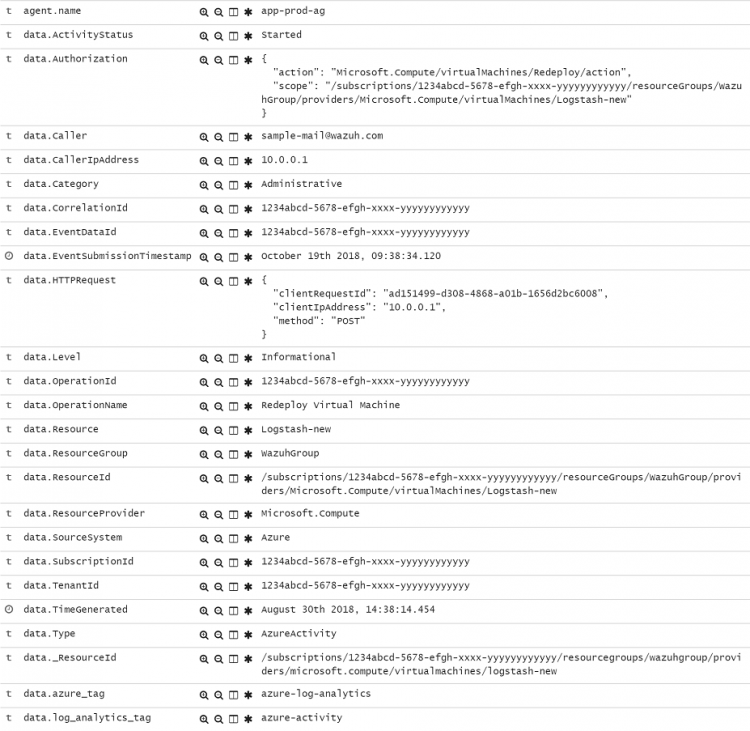
Read and learn how to configure Wazuh to monitor Microsoft Azure on our documentation.
Since 3.7.0, agents can now be added to multiple groups. The agents will receive all the configuration files from each group. This capability is focused on customizing the agent configuration with a higher granularity level.
Using the Wazuh API or the agent_groups script you can manage your groups, list or delete them, and add/remove agents from them.
Let’s see an example, where we add an agent to multiple groups using the API:
curl -u foo:bar -k -X PUT "https://127.0.0.1:55000/agents/001/group/webserver?pretty"
{
    "error": 0,
    "data": "Group 'webserver' added to agent '001'."
}
curl -u foo:bar -k -X PUT "https://127.0.0.1:55000/agents/001/group/apache?pretty"
{
    "error": 0,
    "data": "Group 'apache' added to agent '001'."
}
And now, we can ask the API about the groups where the agent was added:
curl -u foo:bar -k -X GET "https://localhost:55000/agents/001?pretty"
{
    "error": 0,
    "data": {
        "status": "Active",
        "configSum": "f993610d3e6d7bfd7c008b4fb6deb8a5",
        "group": [
            "default",
            "webserver",
            "apache"
        ],
        "name": "ag-windows-12",

    }
}
The cluster capabilities were improved to allow distributed requests. Now the Wazuh API will provide data about the whole infrastructure, instead of only from the master node. As we can see in the following example, we have an agent registered into a worker node:
/var/ossec/bin/cluster_control -a
  ID: 000, Name: manager, IP: 127.0.0.1, Status: Active,  Node: node01
  ID: 001, Name: ubuntu1, IP: 192.168.185.5, Status: Active,  Node: node02

Listing 2 agent(s).
In previous versions, trying to ask for this agent’s operating system information would result on the following output:
curl -u foo:bar -k -X GET "https://127.0.0.1:55000/syscollector/001/os?pretty"
{
   "error": 0,
   "data": {}
}
But now, on Wazuh v3.7.0, the same request is more useful and it will provide the desired information:
curl -u foo:bar -k -X GET "https://127.0.0.1:55000/syscollector/001/os?pretty"
{
   "error": 0,
   "data": {
      "sysname": "Linux",
      "scan": {
         "id": 591663908,
         "time": "2018/10/17 14:34:27"
      },
      "os": {
         "major": "18",
         "name": "Ubuntu",
         "platform": "ubuntu",
         "version": "18.04 LTS (Bionic Beaver)",
         "codename": "Bionic Beaver",
         "minor": "04"
      },

   }
}
In addition to this, the Wazuh API includes a brand-new filtering system. The q parameter allows you to request information using advanced queries. These queries can be built using field names, values, comparison operators (=, !=, ~, < and >) and logical separators (, as OR and ; as AND) to join multiple queries. Check out the following example:
curl -u foo:bar -k -X GET "https://127.0.0.1:55000/agents?pretty&q=os.name=ubuntu;os.version>12&select=id,name,os.name,os.version,os.codename,os.major"
{
    "error": 0,
    "data": {
        "totalItems": 2,
        "items": [
            {
                "os": {
                "codename": "Bionic Beaver",
                "version": "18.04.1 LTS",
                "major": "18",
                "name": "Ubuntu"
                },
                "name": "wazuh",
                "id": "000"
            },
            {
                "os": {
                "codename": "Xenial Xerus",
                "version": "16.04.5 LTS",
                "major": "16",
                "name": "Ubuntu"
                },
                "name": "ubuntu",
                "id": "001"
            }
        ]
    }
}
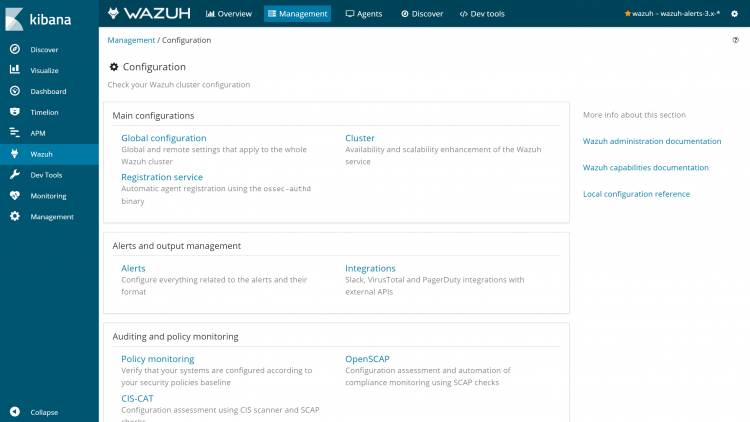
The Wazuh apps come with full support for the latest Elastic Stack and Splunk versions, and lots of new features such as:
As shown before, now you can get on demand the current manager/agent configuration on the redesigned tabs. The interface has been organized in a convenient way, and each setting is displayed in a more human-readable format for better comprehension. Besides, the JSON/XML viewers received a revamp to be more responsive on different screen sizes.
The Splunk app now also includes some features that were already present on the Kibana alternative such as the Dev tools and Inventory data tabs, app logs, etc.
The File Integrity and Analysis engines received numerous performance improvements, making them more efficient with fewer resources:
The multithreaded internal structure of the Analysis engine is shown in the diagram below:

Find more details about how this new architecture works on our documentation.
Further information and documentation can be found at the following URLs:
We would also like to thank our developers, contributors, and users. We are looking forward to your feedback, so please don’t hesitate to post on our mailing list if you have any question. We also have a Slack channel.